The normalized difference vegetation index (NDVI) was developed in the 1970s. It is commonly used to analyze multispectral satellite images. The objective is to create crop health maps and define management zones.
How does it work?
The key is in the process of photosynthesis.
As we all know, plants convert sunlight energy into chemical energy that can later be released to fuel the organism’s activities. The spectral range of solar radiation that plants are able to use in photosynthesis corresponds more or less with the range of light visible to the human eye (400 to 700 nanometers).
Photons at shorter wavelengths are mostly filtered out by the ozone layer in the stratosphere. Photons at longer wavelengths do not carry enough energy to allow photosynthesis to take place. The near-infrared (NIR) is one such longer wavelength. Leaf cells have evolved to re-emit solar radiation in the near-infrared spectral region, because the photon energy at wavelengths longer than about 700 nanometers is too small to synthesize organic molecules. A strong absorption at these wavelengths would only result in overheating the plant and possibly damaging the tissues.
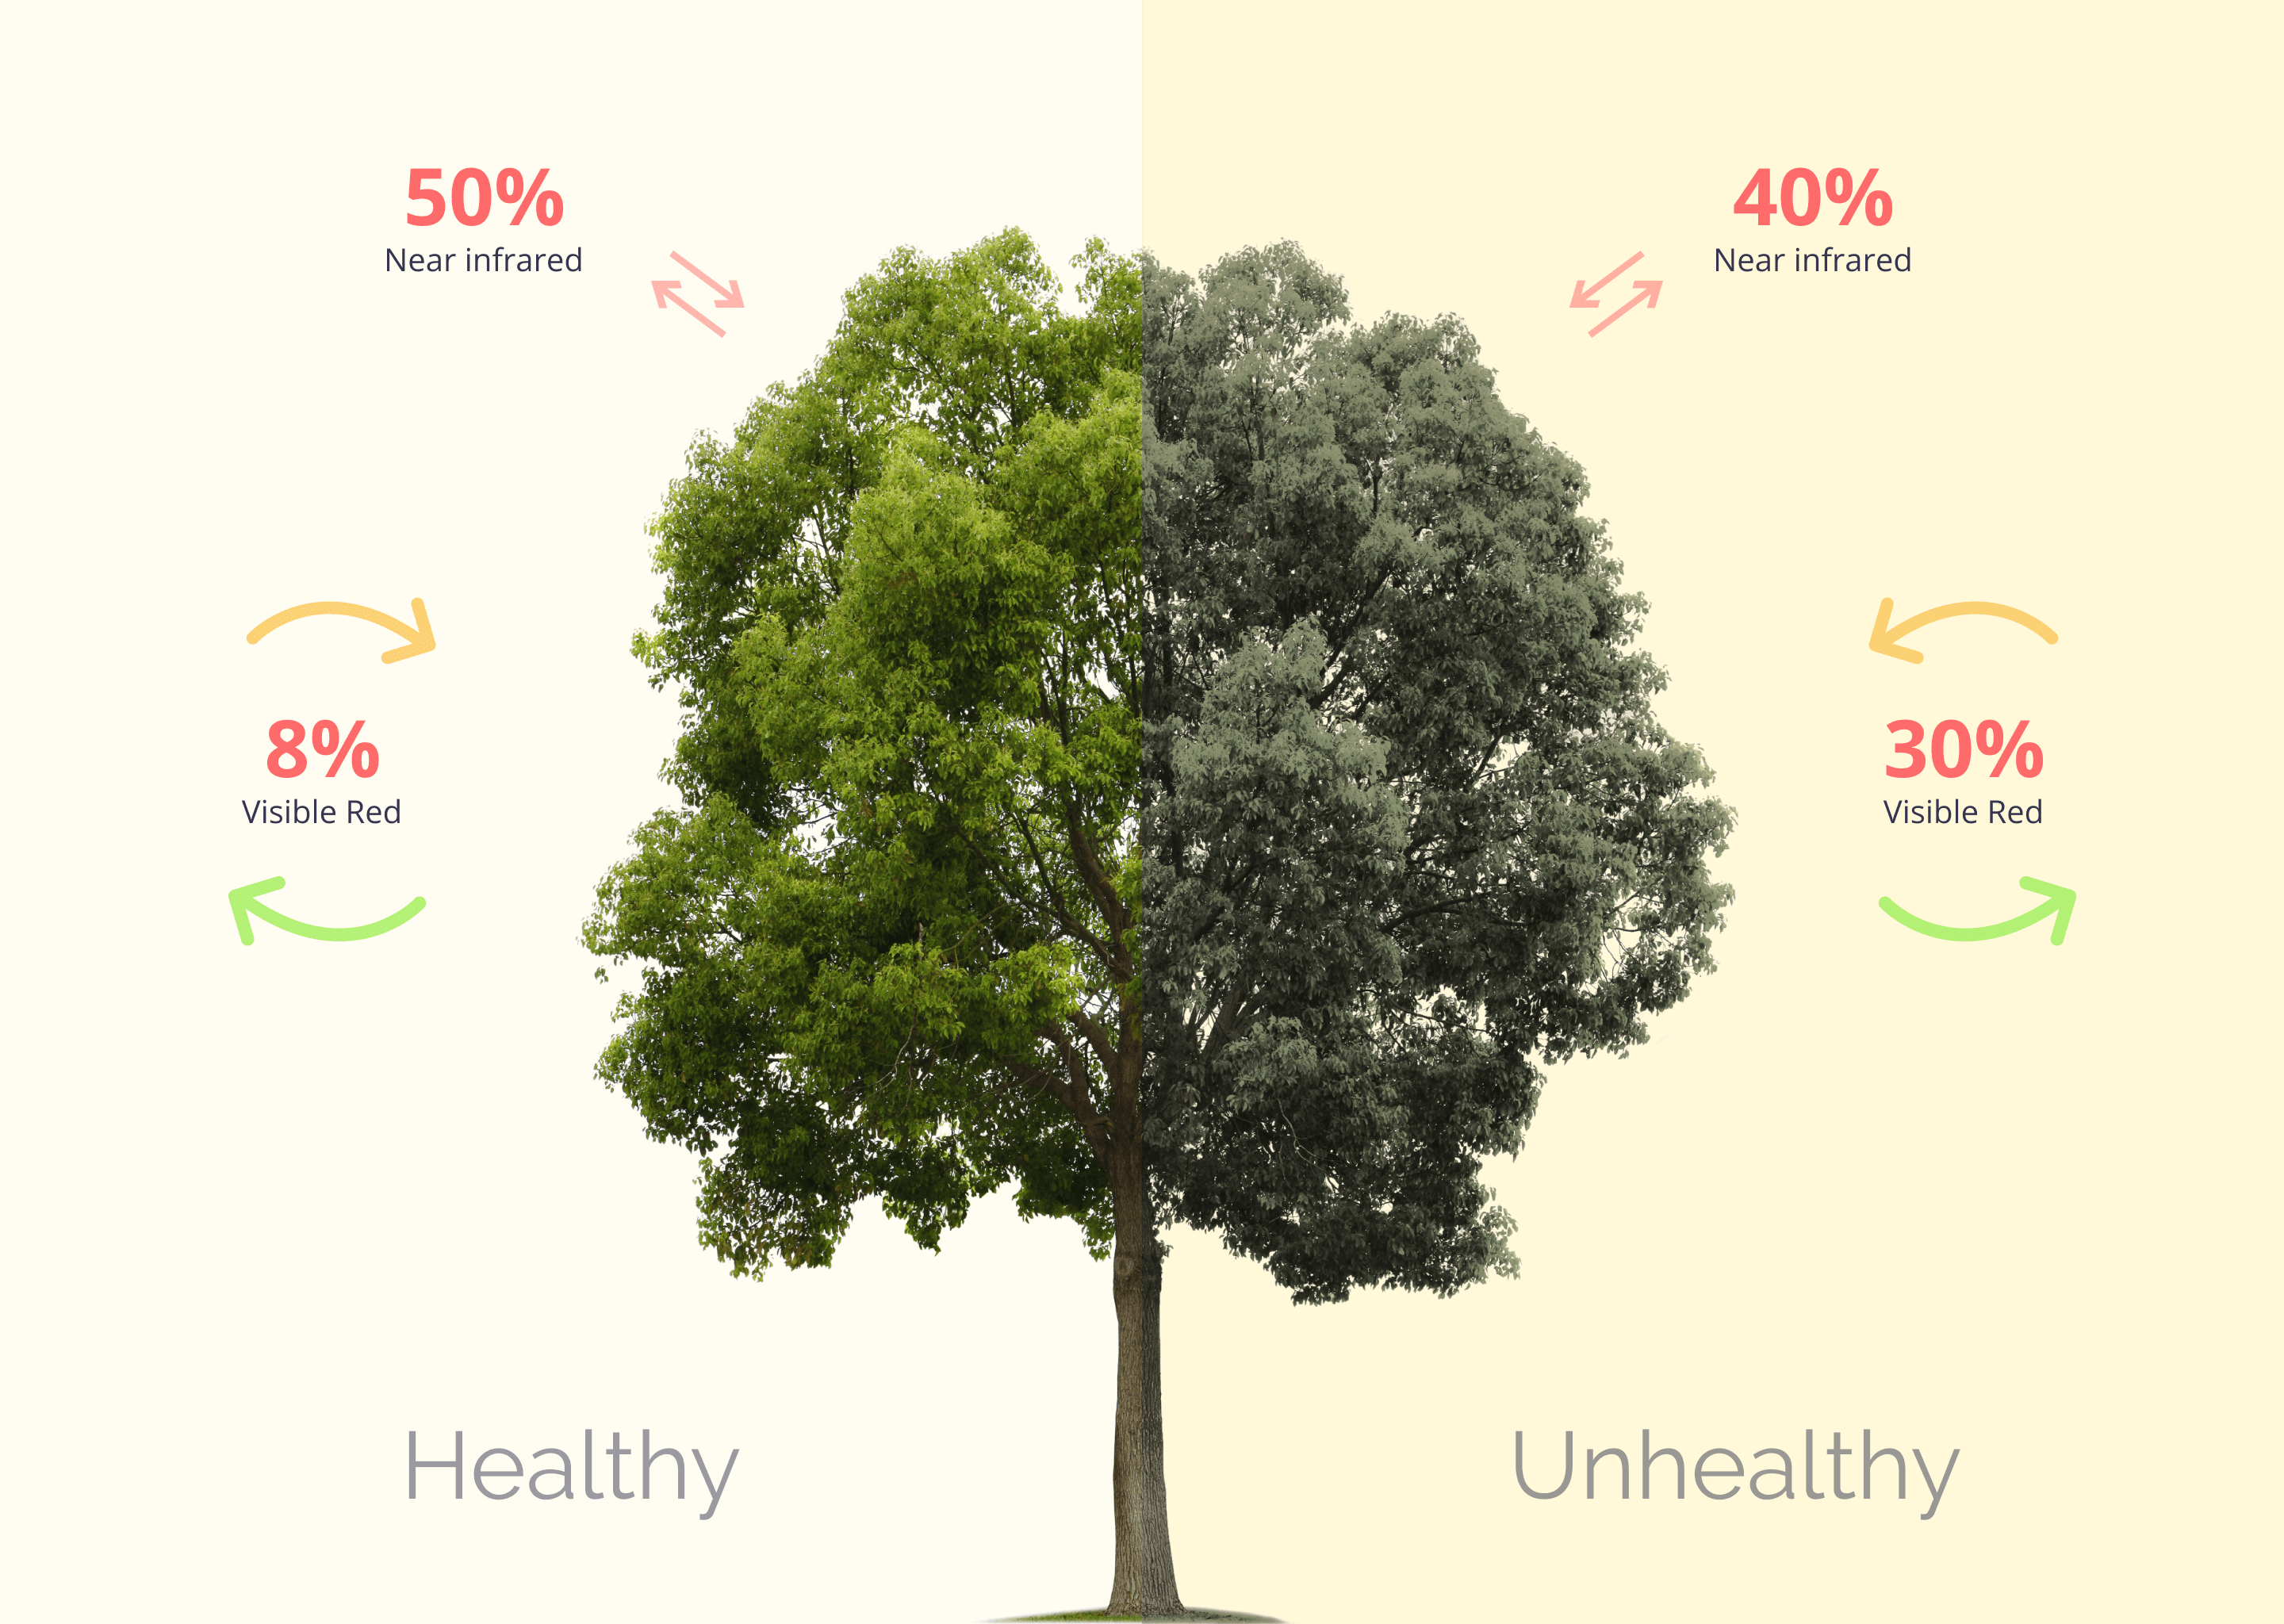
In healthy plants, the pigment in plant leaves, chlorophyll, strongly absorbs visible light (from 400 to 700 nm) for use in photosynthesis. The cell structure of the leaves, on the other hand, strongly reflects near-infrared light (from 700 to 1100 nm).
When the crop is affected by dehydration, disease or pest, the plants absorb more of the near-infrared light, rather than reflecting it.
Satellites are equipped with multispectral sensors able to detect both the visible (red) light and the NIR. Simply, the NDVI image analysis compares mathematically the values of absorbed visible red light and the reflected near-infrared light. Observing how NIR changes compared to red light provides an accurate indication of the presence of chlorophyll, which correlates with plant health.
Thus, we can create accurate maps indicating zones within the fields where the plants are under stress.
How to use the NDVI maps ?
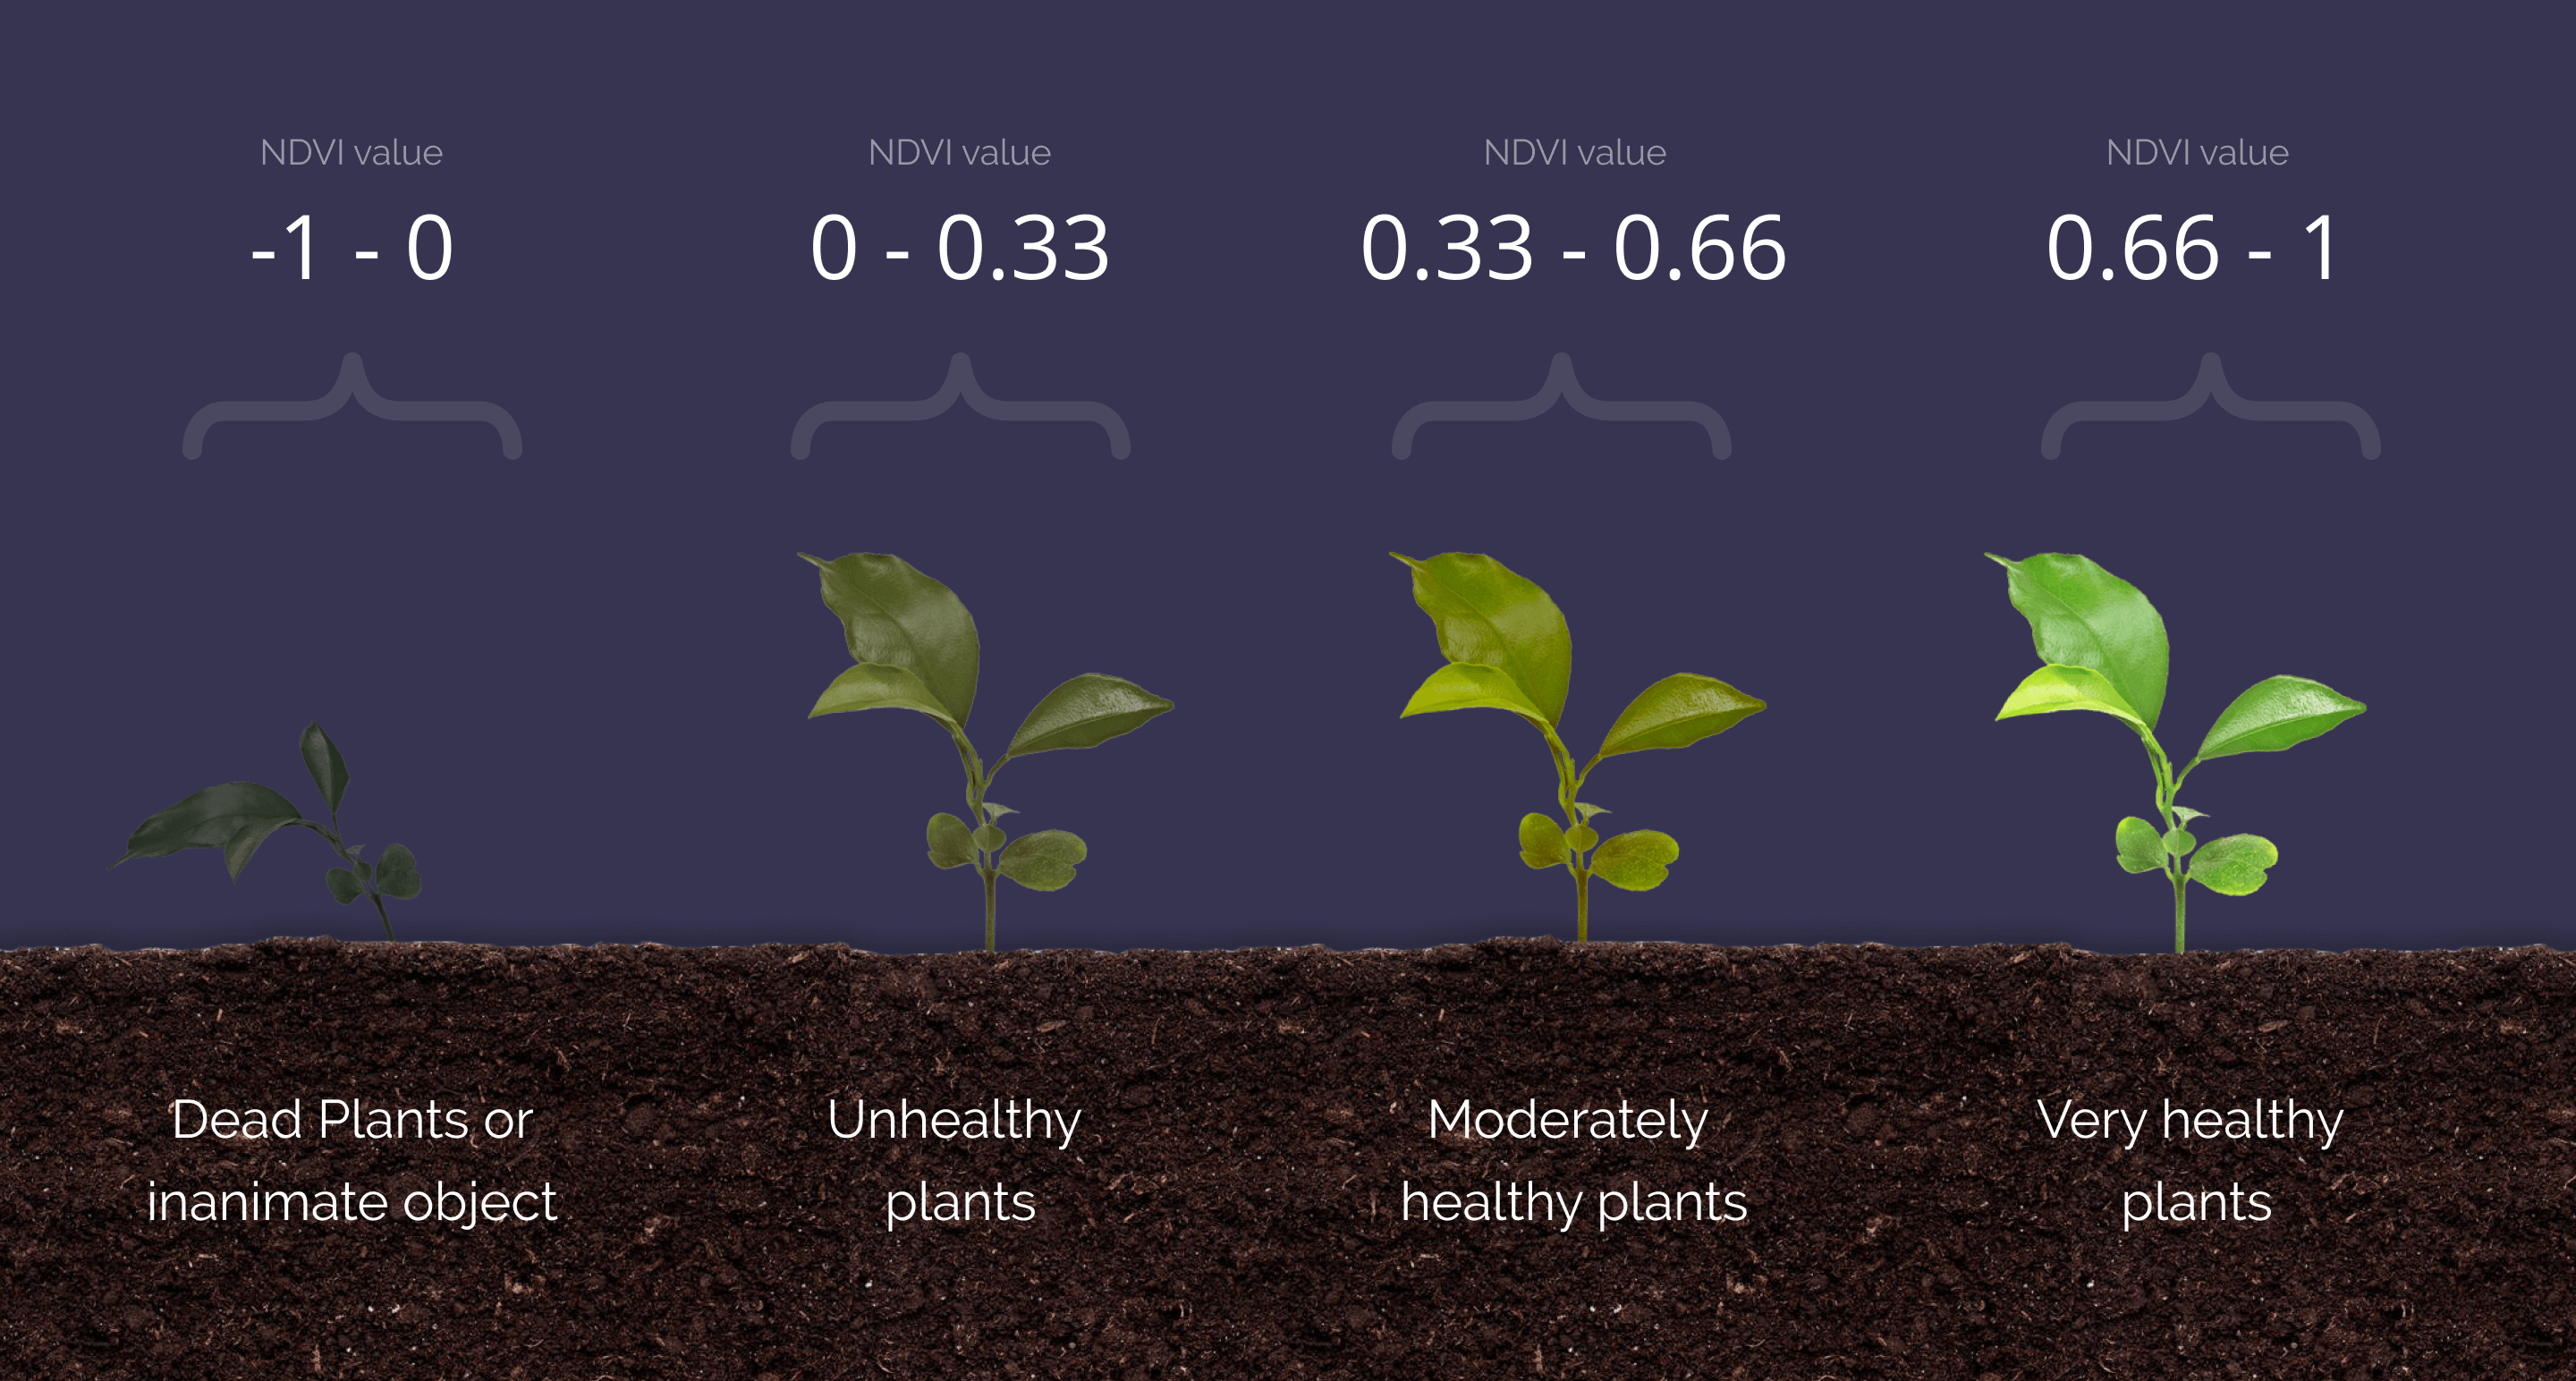
The NDVI results range from -1 to 1. Below, you’ll find a general scheme showing the correspondence between the NDVI values and the crop health state:
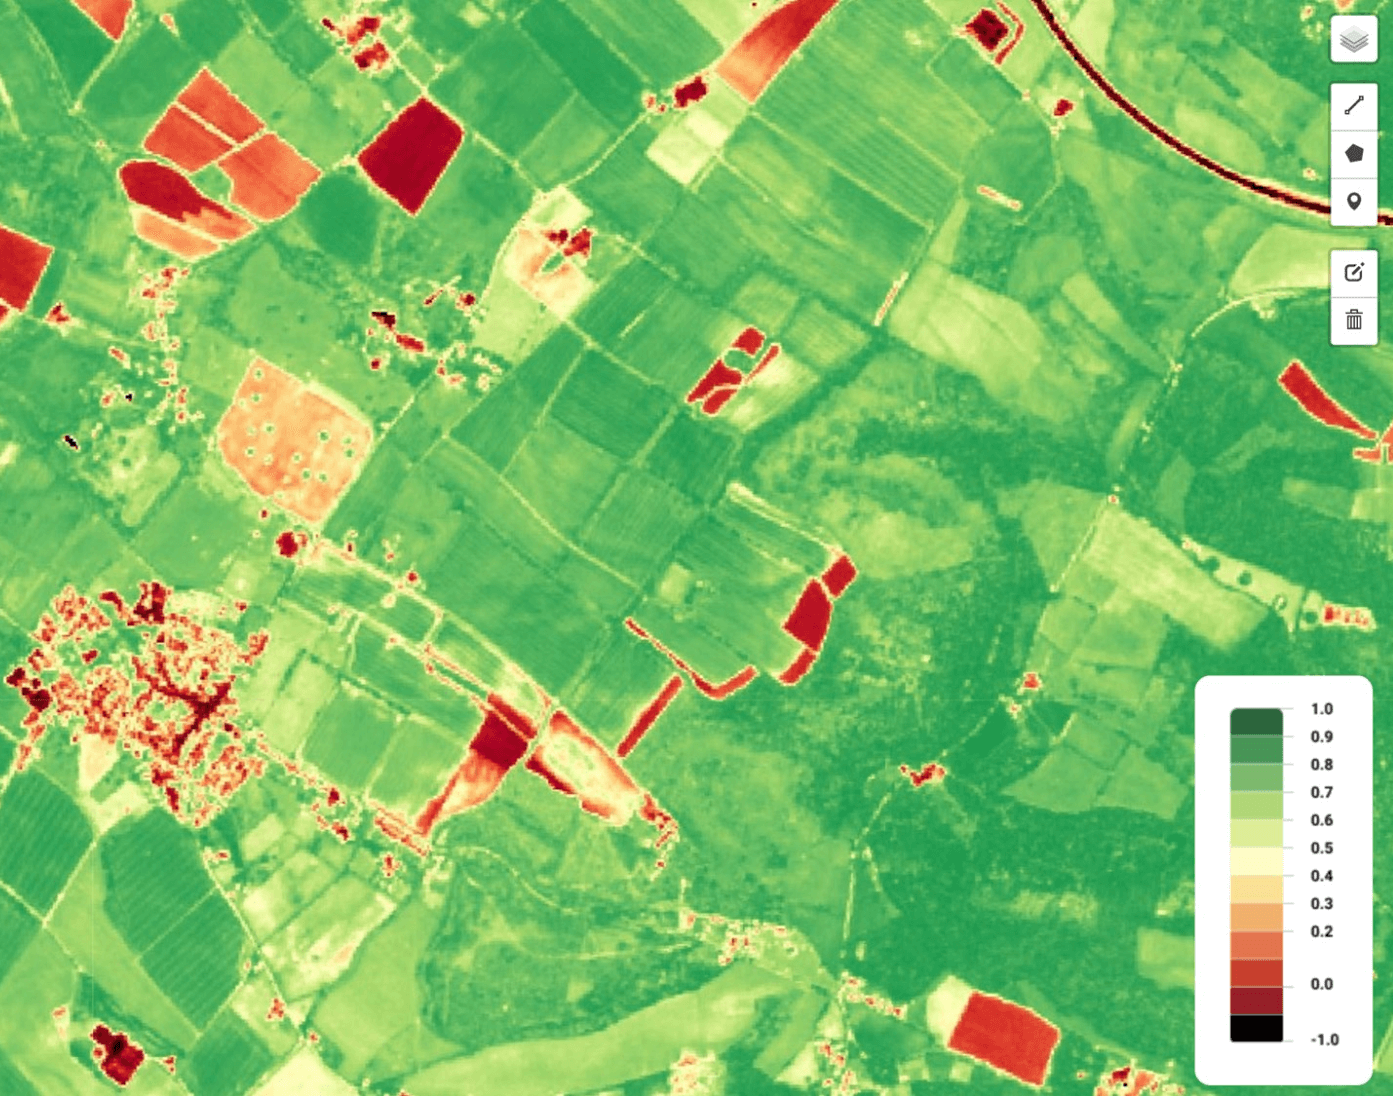
Typically, digital platforms providing satellite images to farmers use a color scheme to facilitate the interpretation of NDVI results. At AgroHelper, we use the following:
The next step is to define management zones based on the NDVI map. The delimitation of management zones using NDVI data generated from satellite images shows high convergence with the management zones using productivity data from systems coupled to harvesters. Thus, NDVI maps can replace or be complementary to productivity data for delimiting management zones for annual crops.
Defining management zones based on the varying conditions throughout a field, allows to optimize the application of water, fertilizer and pesticides with variable rate prescriptions. If applied successfully, the solution leads to producing more crops with less inputs.

Mihail Marinov, co-founder at Agrohelper